Renewable Energy Balance
About the project
With the rise of residential solar and wind electricity generation, utilities are looking for ways to help customers understand the impact on their overall bill.
Since generation data is held by third-party companies, we were asked to build a tool that educates customers on their usage with the limited data the utilities can provide. This also meant that we could only provide energy usage data and not billing details.
Launch Date: August 2017
Product Team: Eric Burns
Role: Lead UX Designer
What we built
A white label web application used by many utilities that allows users to understand how their renewable generation was affecting their final bill.
How it did
Deployed to hundreds of thousands of customers generating their own renewable energy. I left Opower shortly after deployment and was unable to gather final results.
The business problem
- Utilities needed to better support net metering (renewable energy) customers and provide personalized experiences.
- Utilities wanted to drive increased customer satisfaction in the wake of growing competition.
- Renewable energy customers drive more calls than average customers.
Product goals
- Educate users on the import/export to the grid model and reduce need to reach out to customer service.
- Build trust by displaying up-to-date electricity data in a helpful way for renewable energy users.
- Help users evaluate whether their investment is beneficial.
Project definition and concepting
I collaborated with stakeholders to develop ideation opportunities and scope.
Early definition and ideation are most successful when pulling in a diverse array of stakeholders.
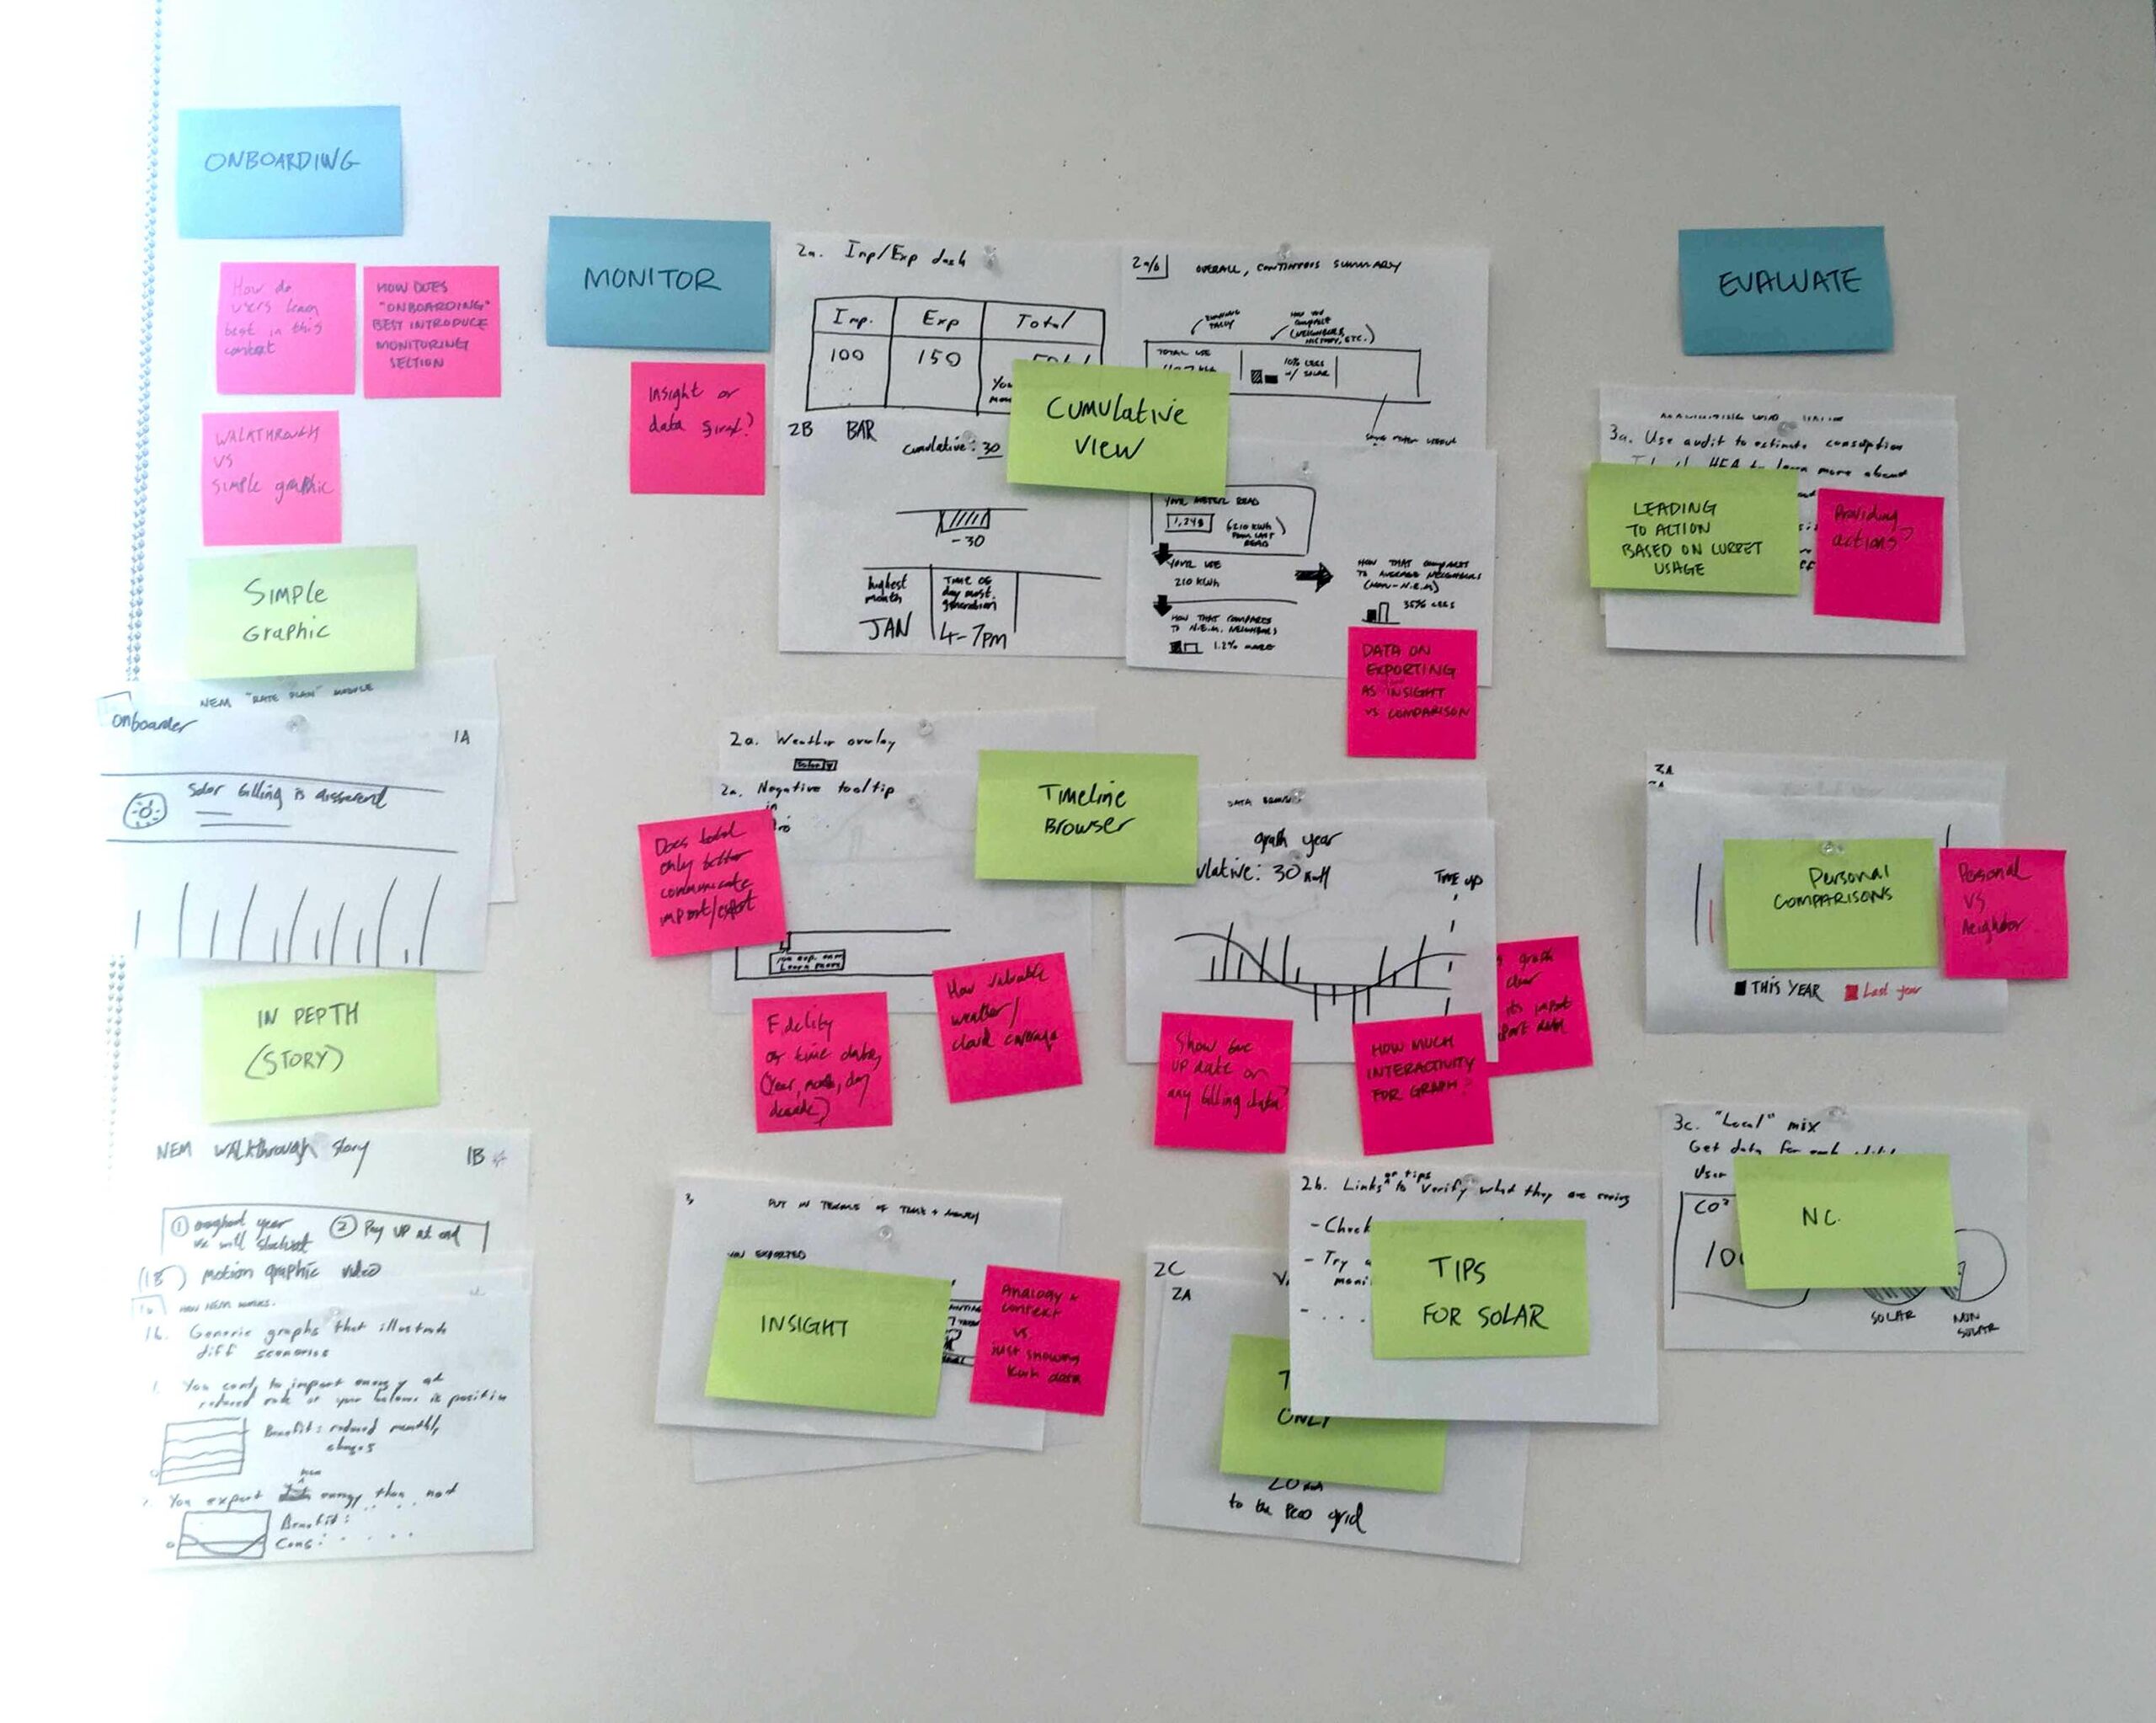
I facilitated an initial ideation workshop
I led a small group of designers, engineers and product managers to sketch as many concepts as we could
Concept testing
The early concepting sessions gave us a few concept parameters for us to test with end users.
Research background
- Participants
- 7 participants from 6 states.
- All had solar, 1 also had a wind turbine & hydro paddle.
- Method
- Qualitative 1:1 remote sessions, 45 minutes long.
- Interview and think-aloud walkthrough of two design concepts.
- Highlights
- Customers value both monthly and annual information, but tend to seek out the monthly information first.
- The study challenged our assumption that most renewable energy generating customers are more engaged and understand their energy use and billing.
- Renewable generation is shifting from “early adopters” to mainstream acceptance.
- We heard from most participants that they haven’t saved as much as they expected to with solar.
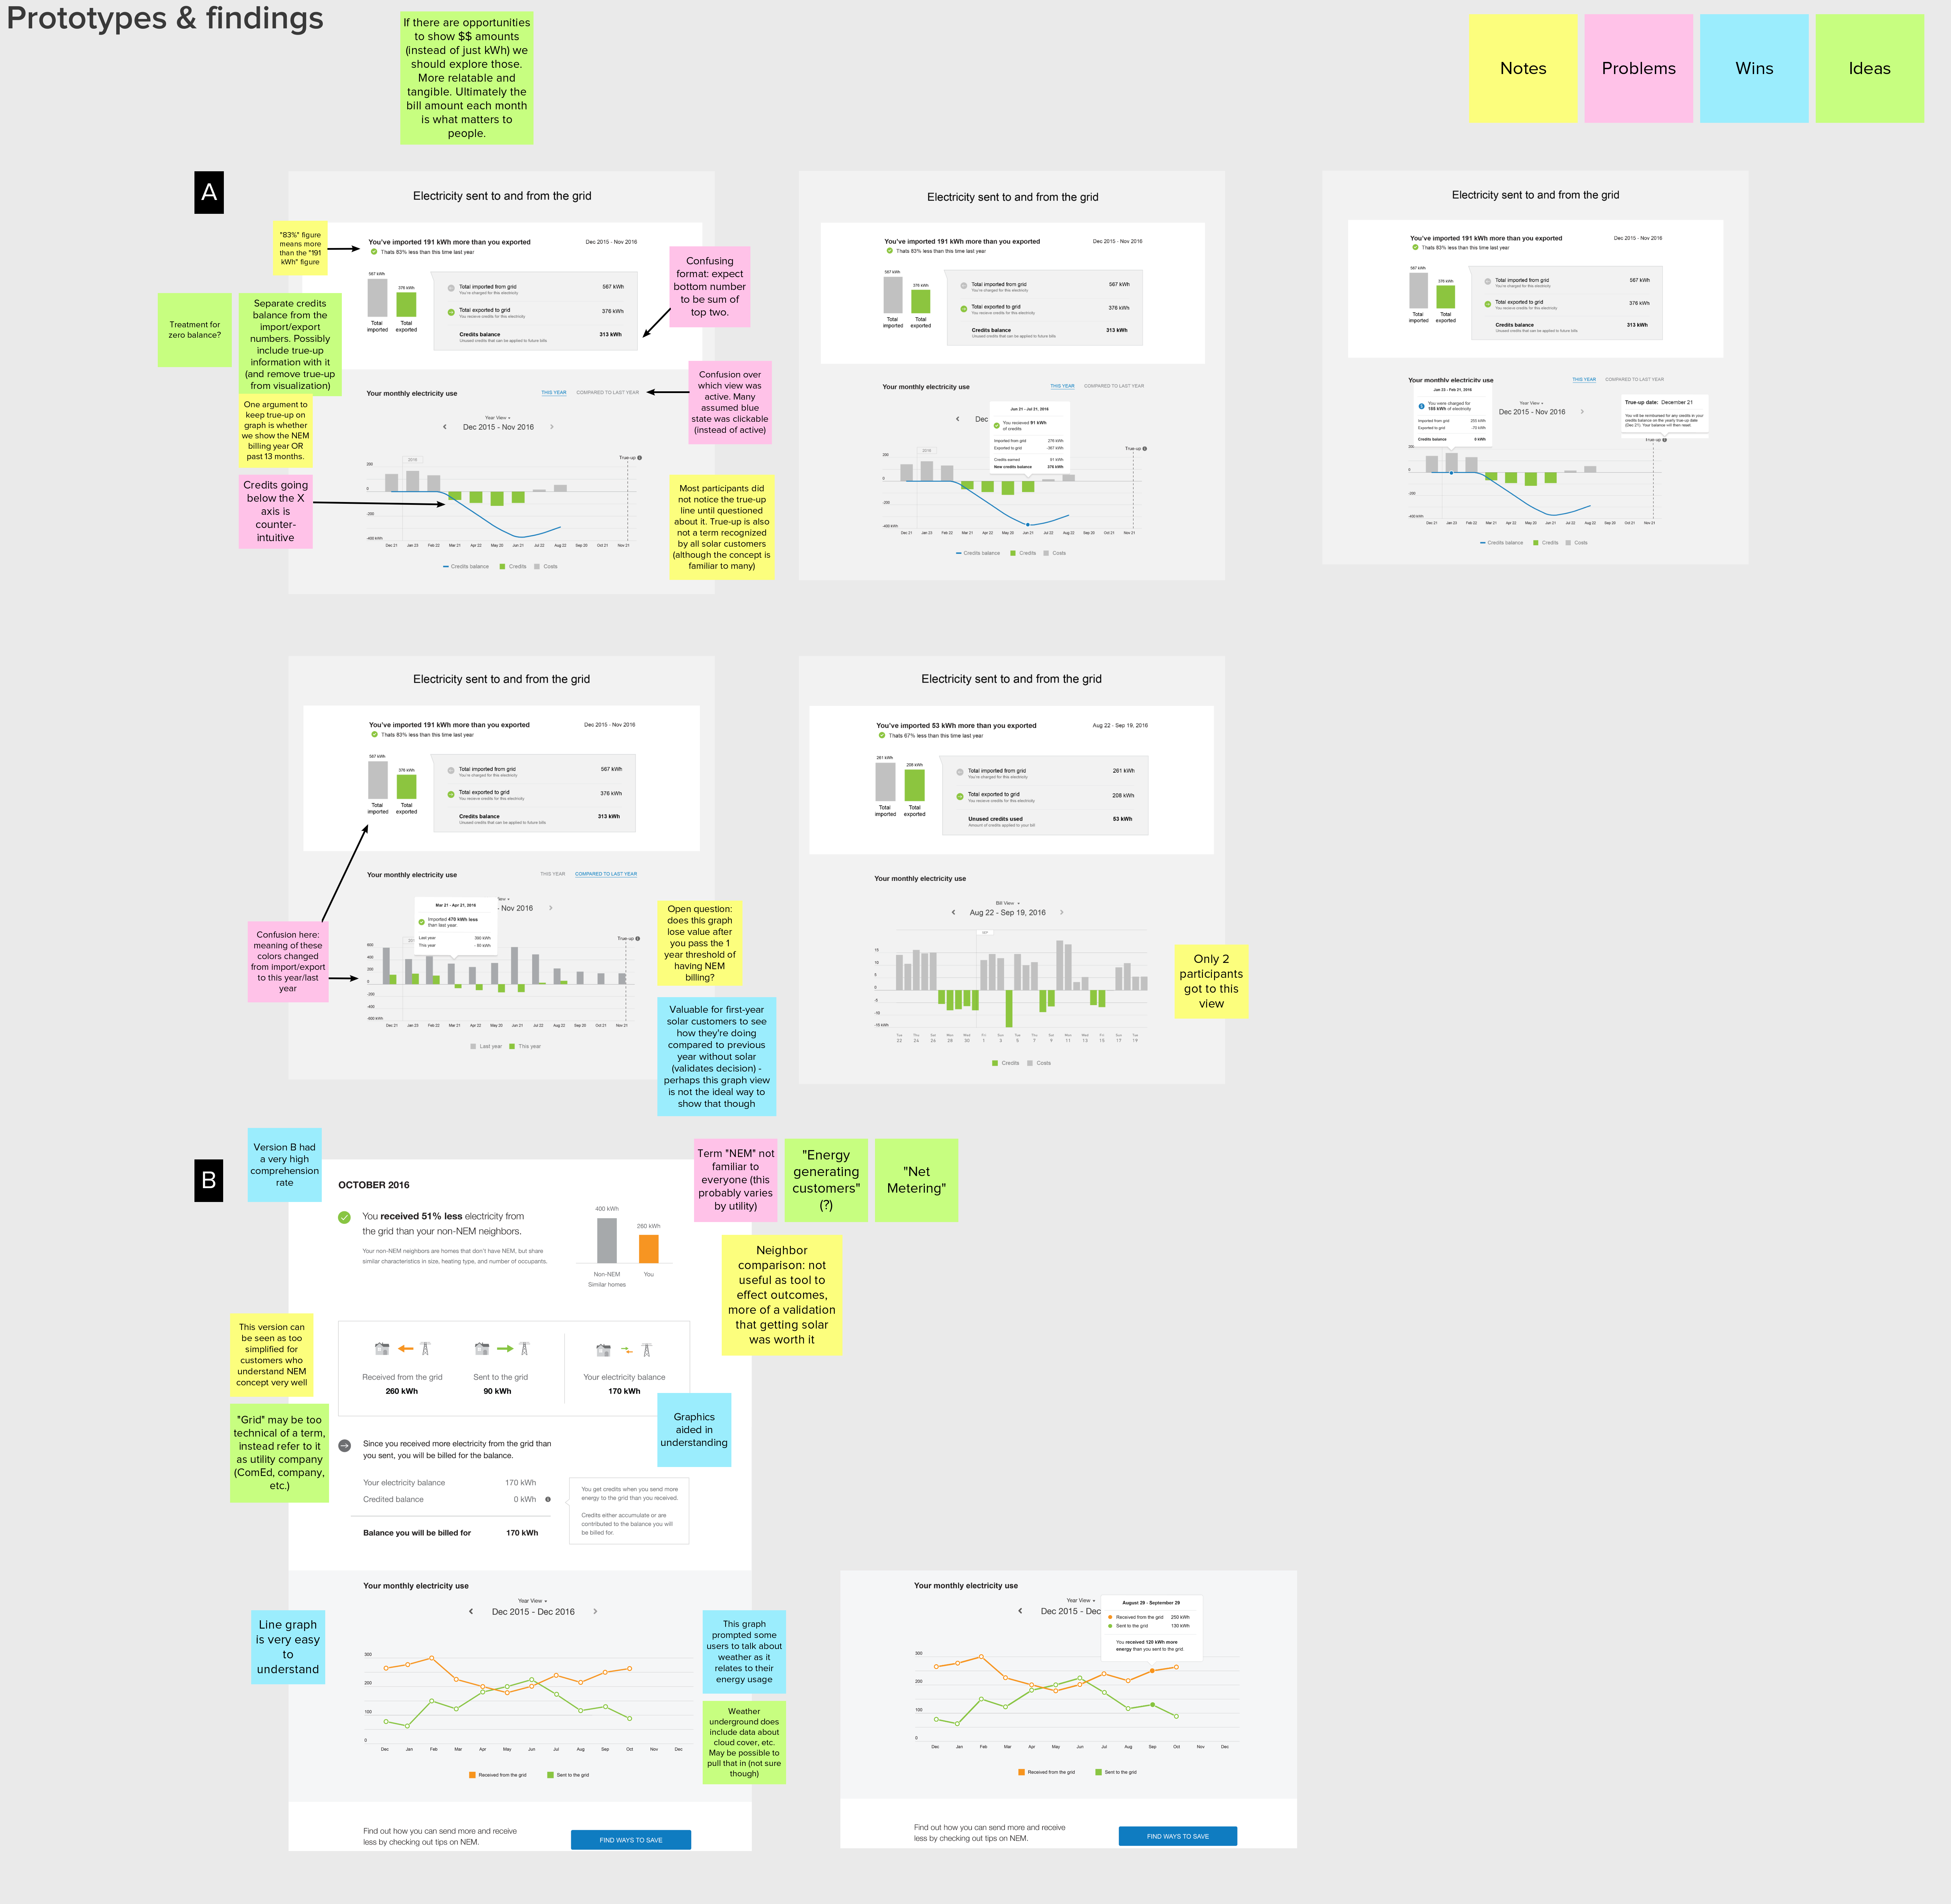
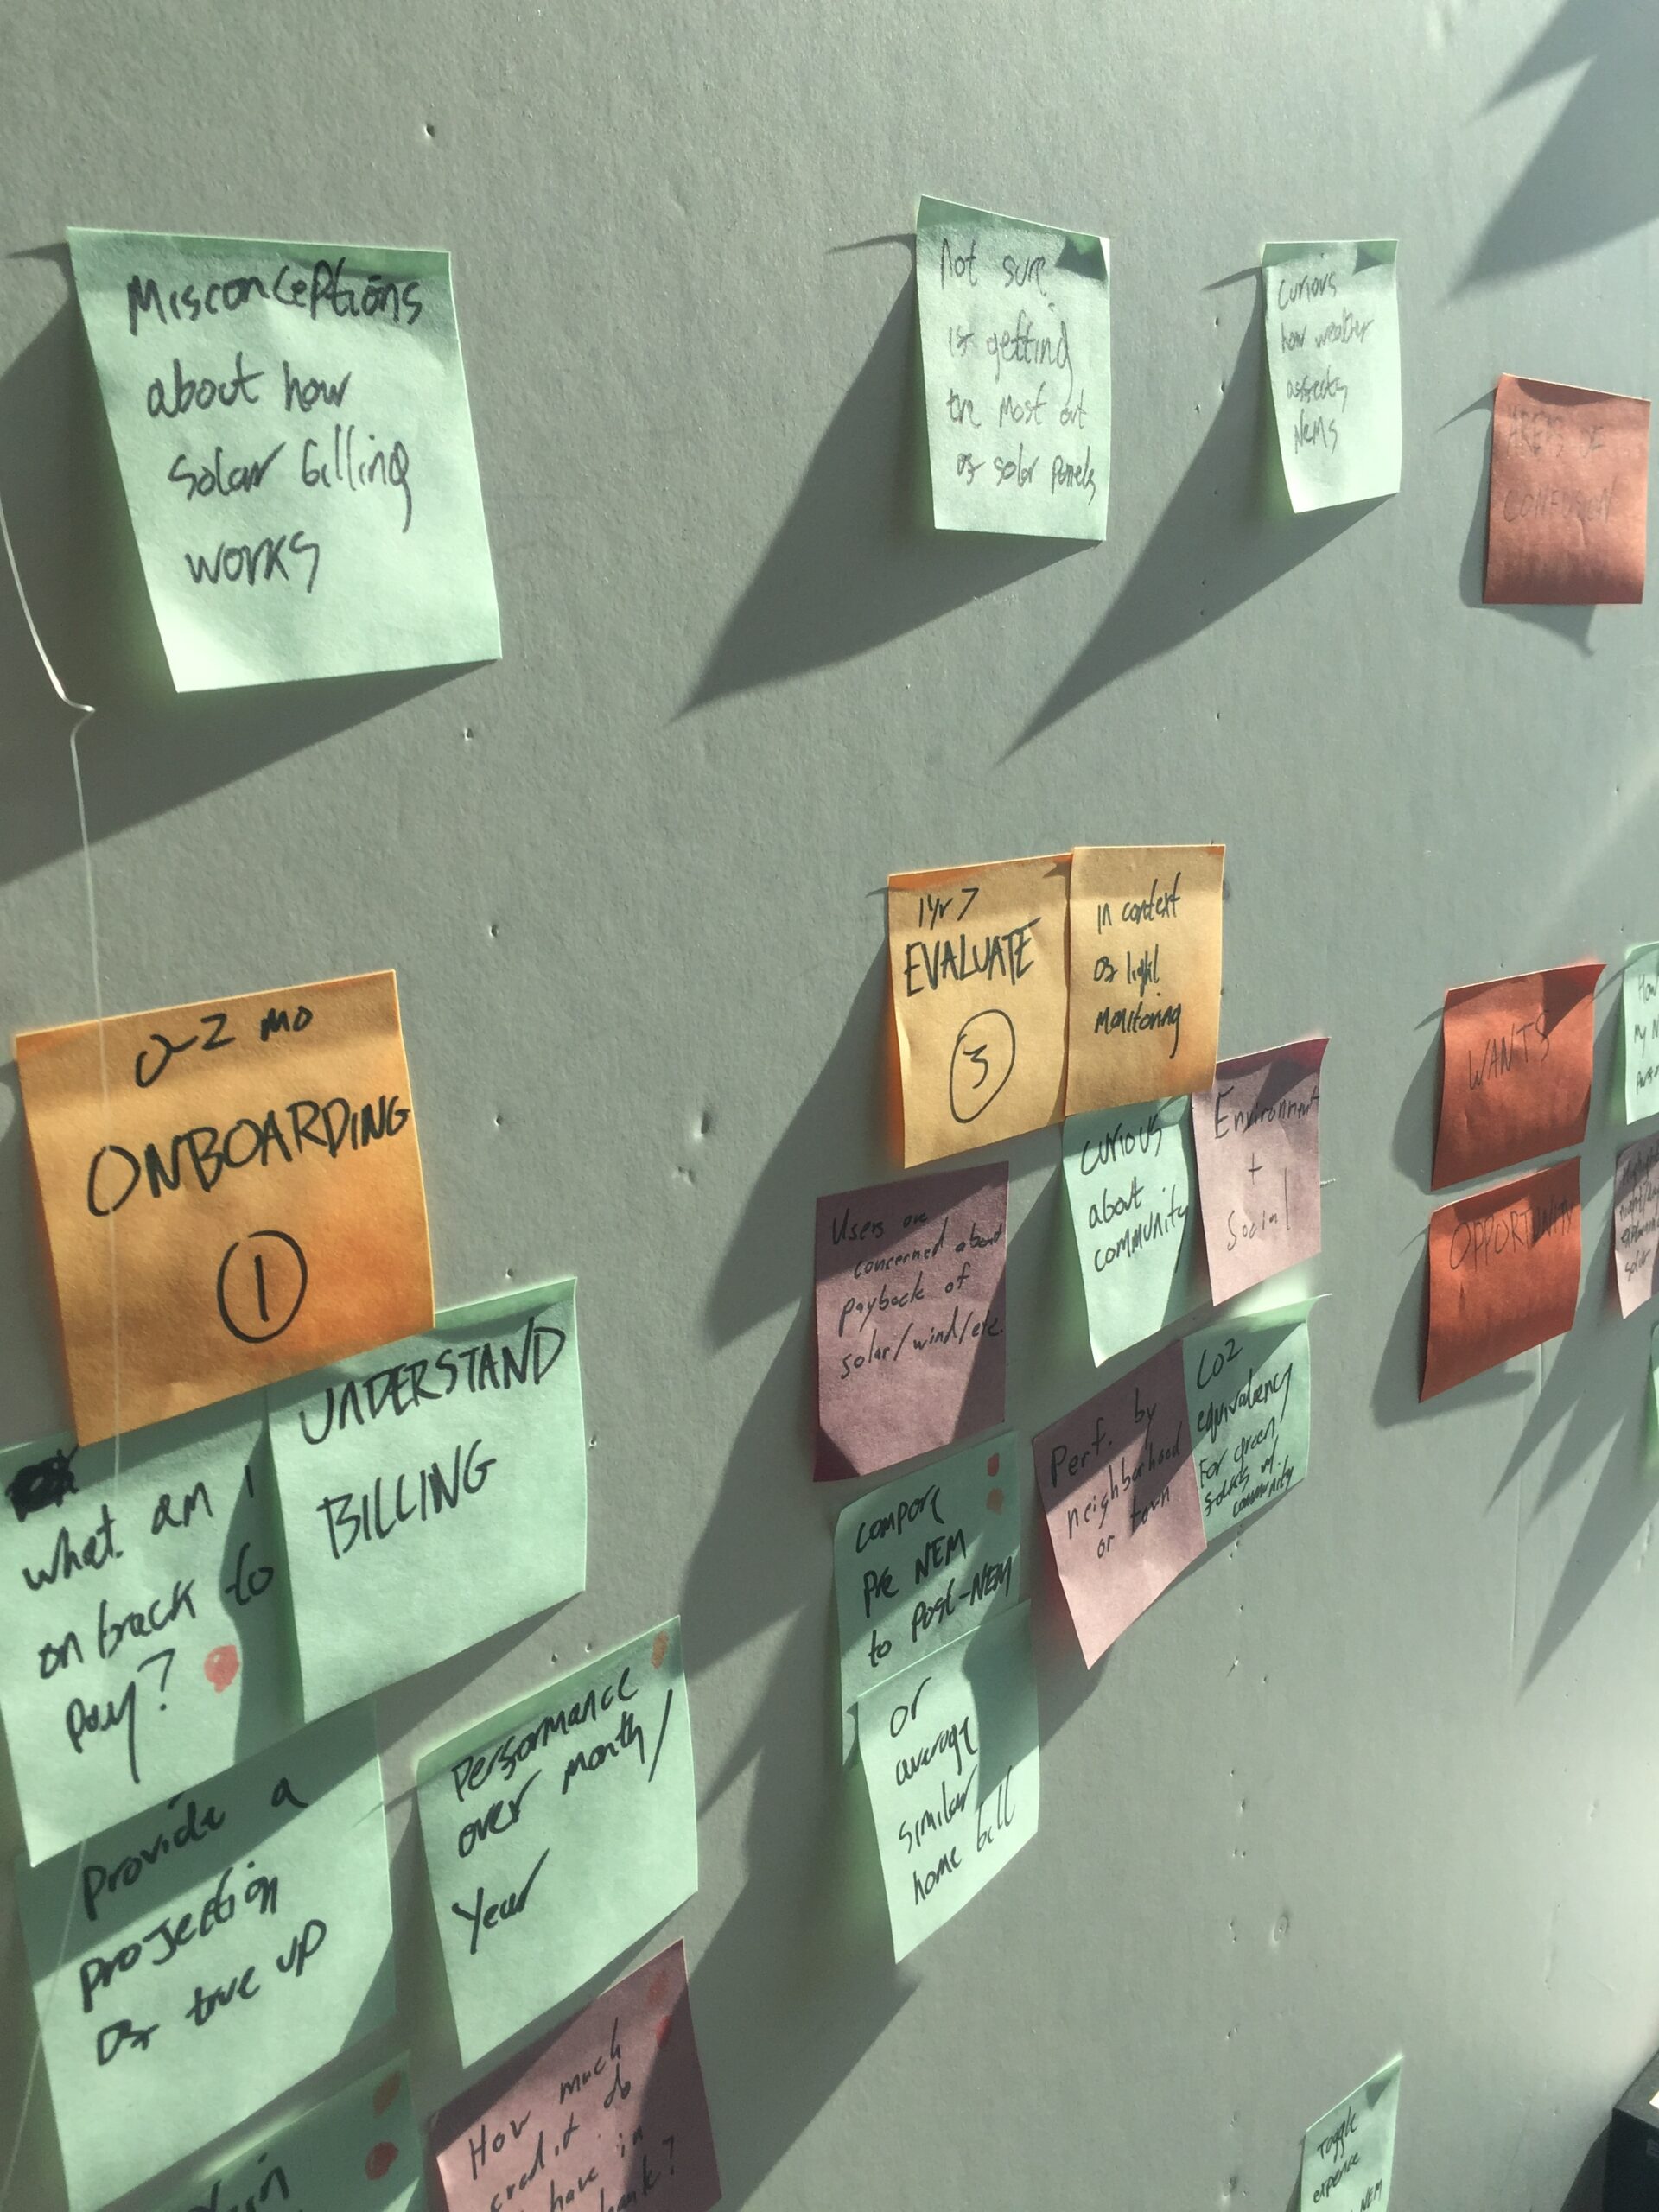
We used a mural board to document some of our findings.
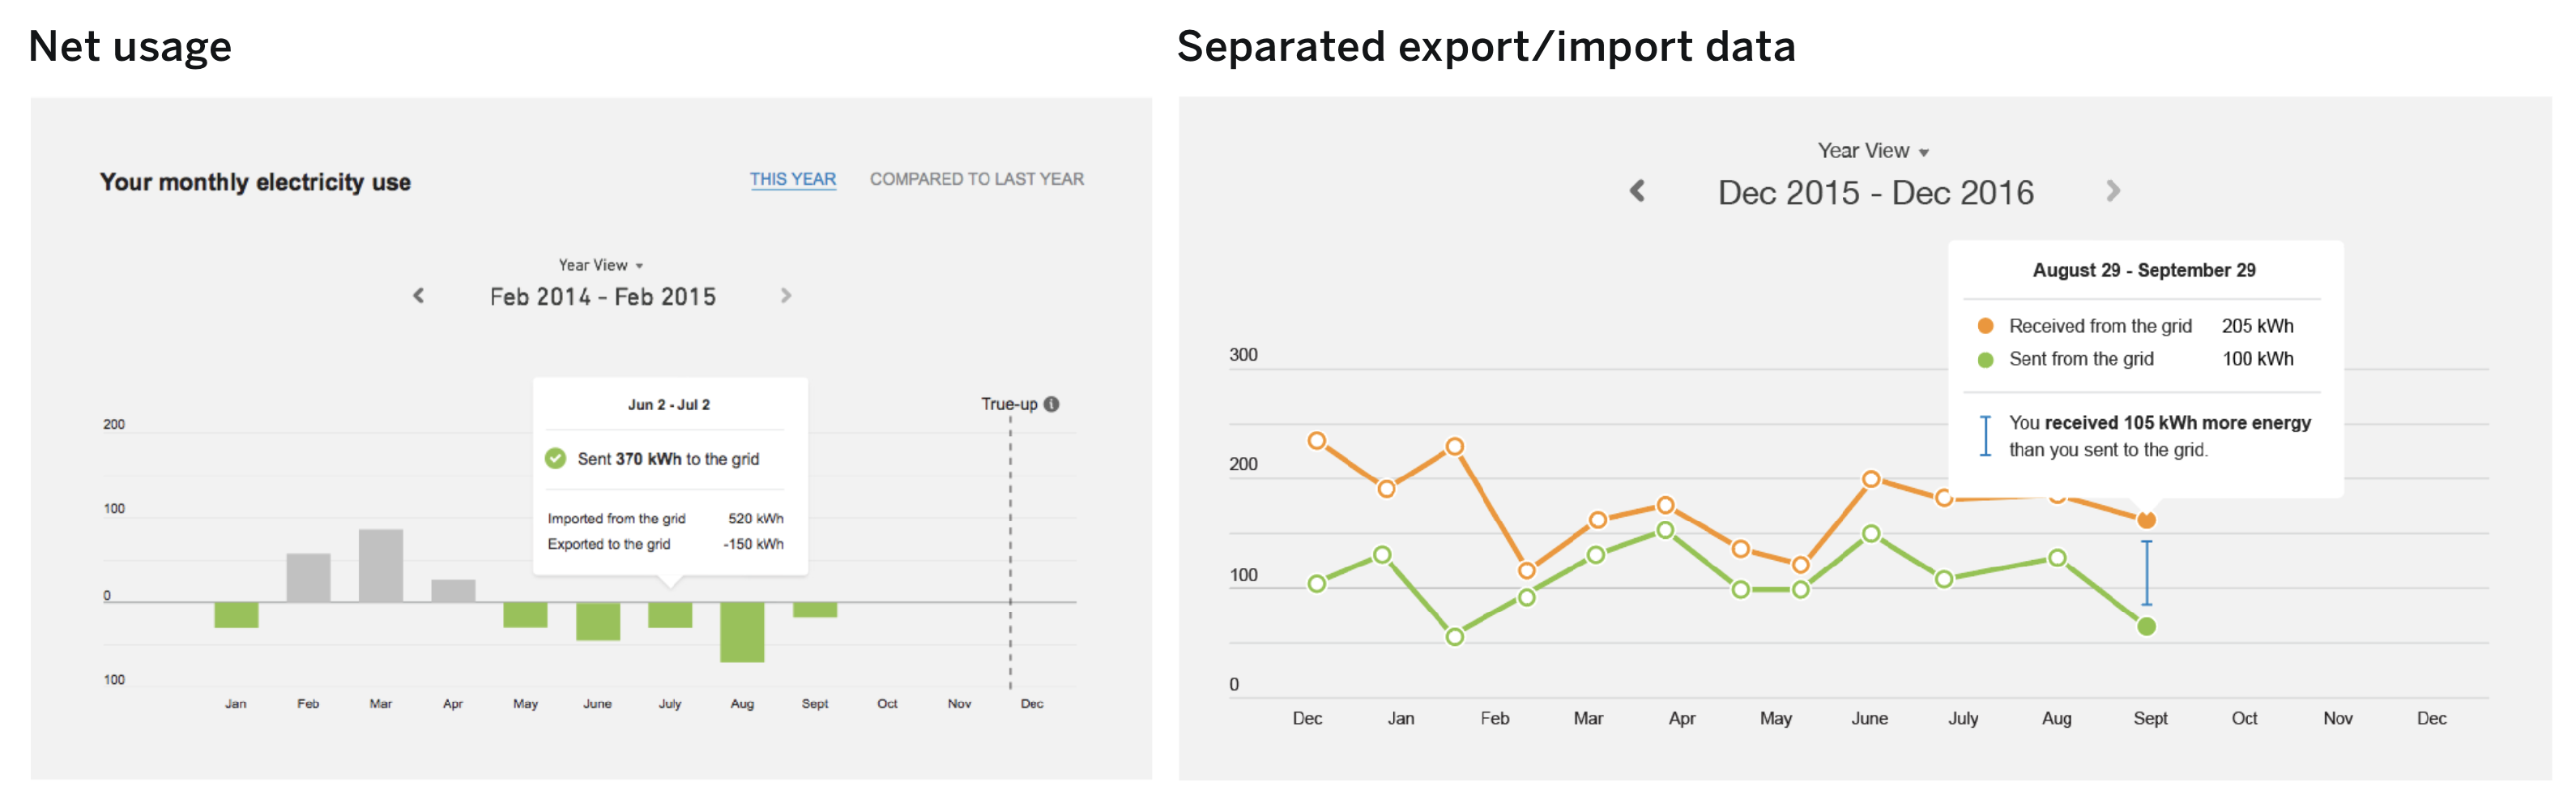
Should we emphasize displaying the net usage balance or separated import and export data?
- Users could better interpret the graph when energy use was seperated into import and export.
- The net result was better received as an overall insight.
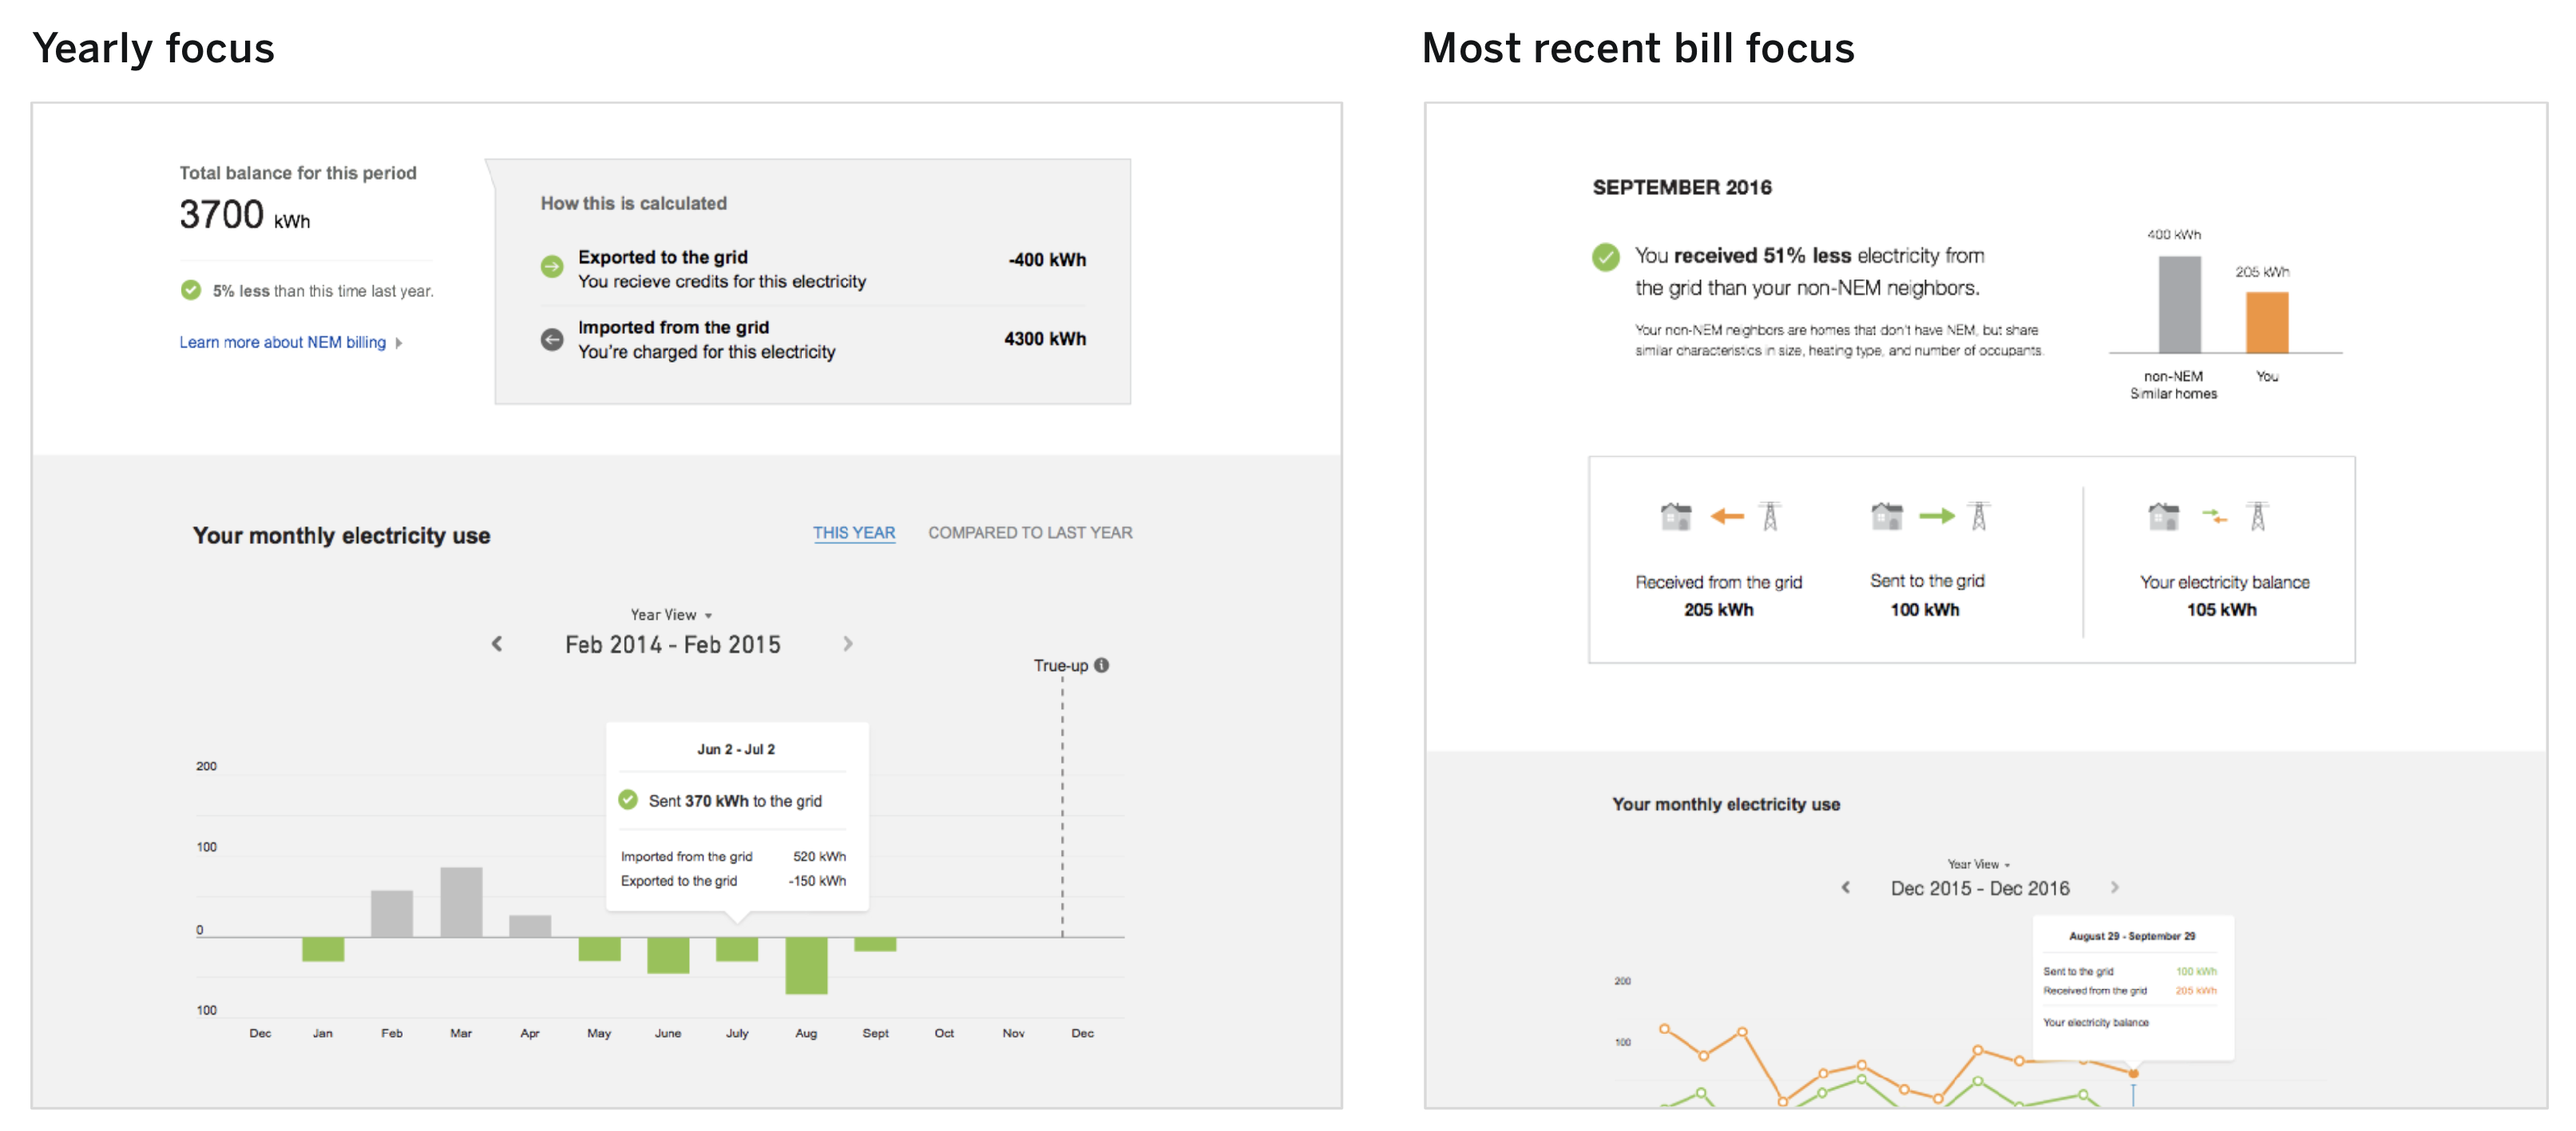
Is it more effective to focus on yearly data or monthly data?
- While given seasonal changes in solar mean the next yearly balance is important, seeing the data monthly first is more accessible for the user since that's how they see their bill.
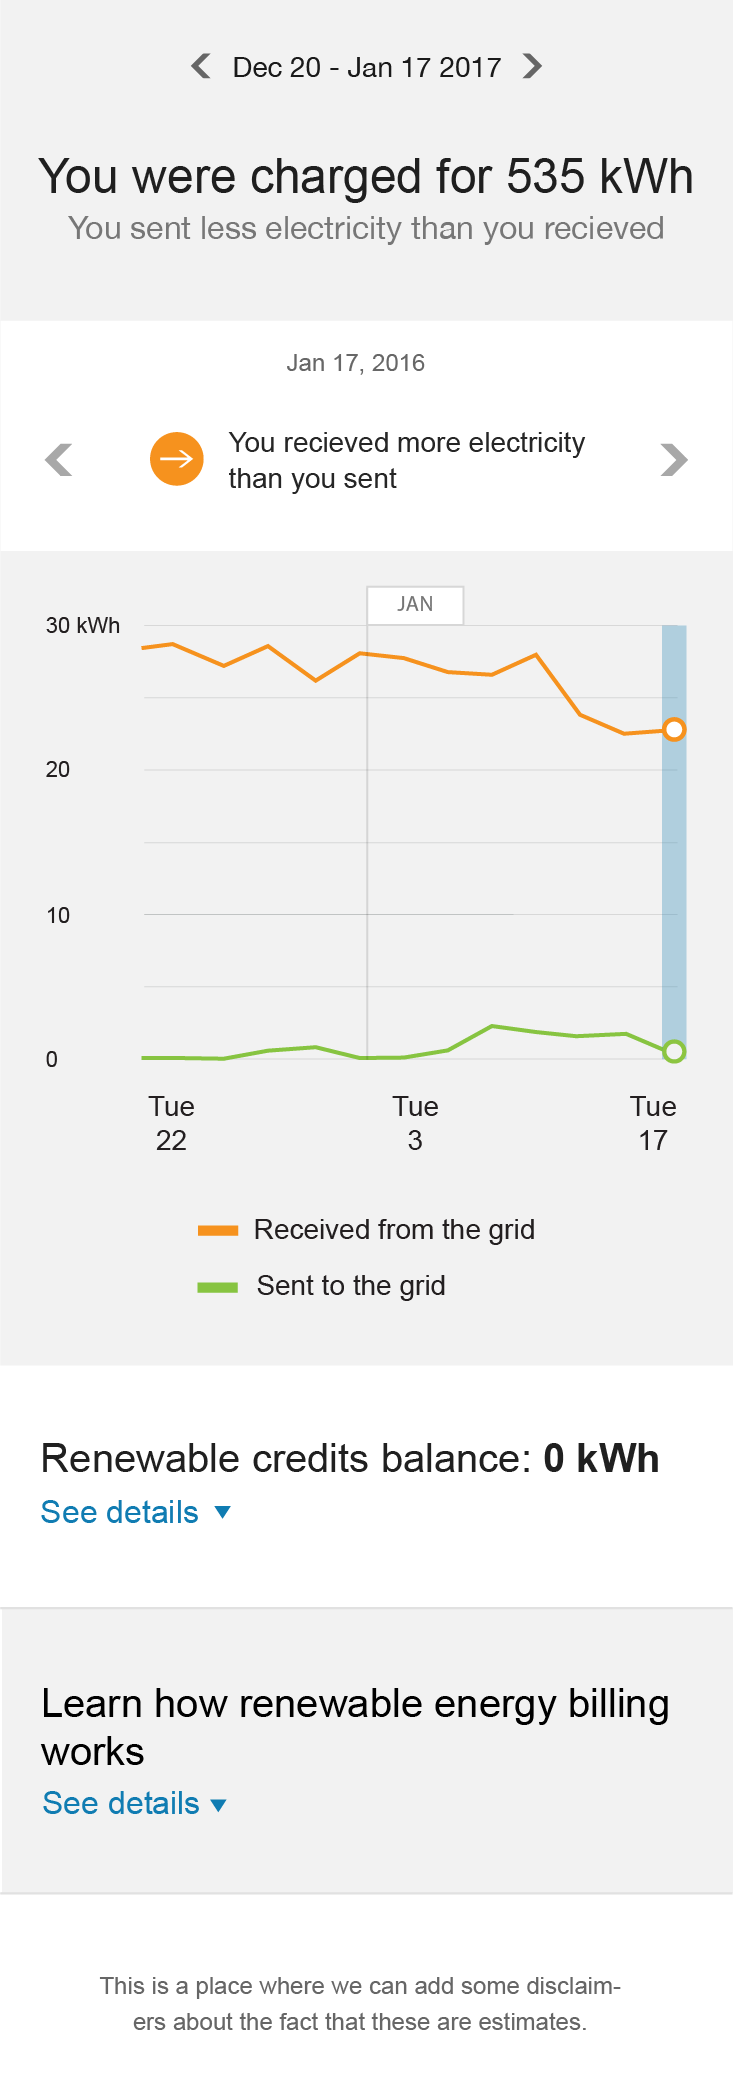
Final design
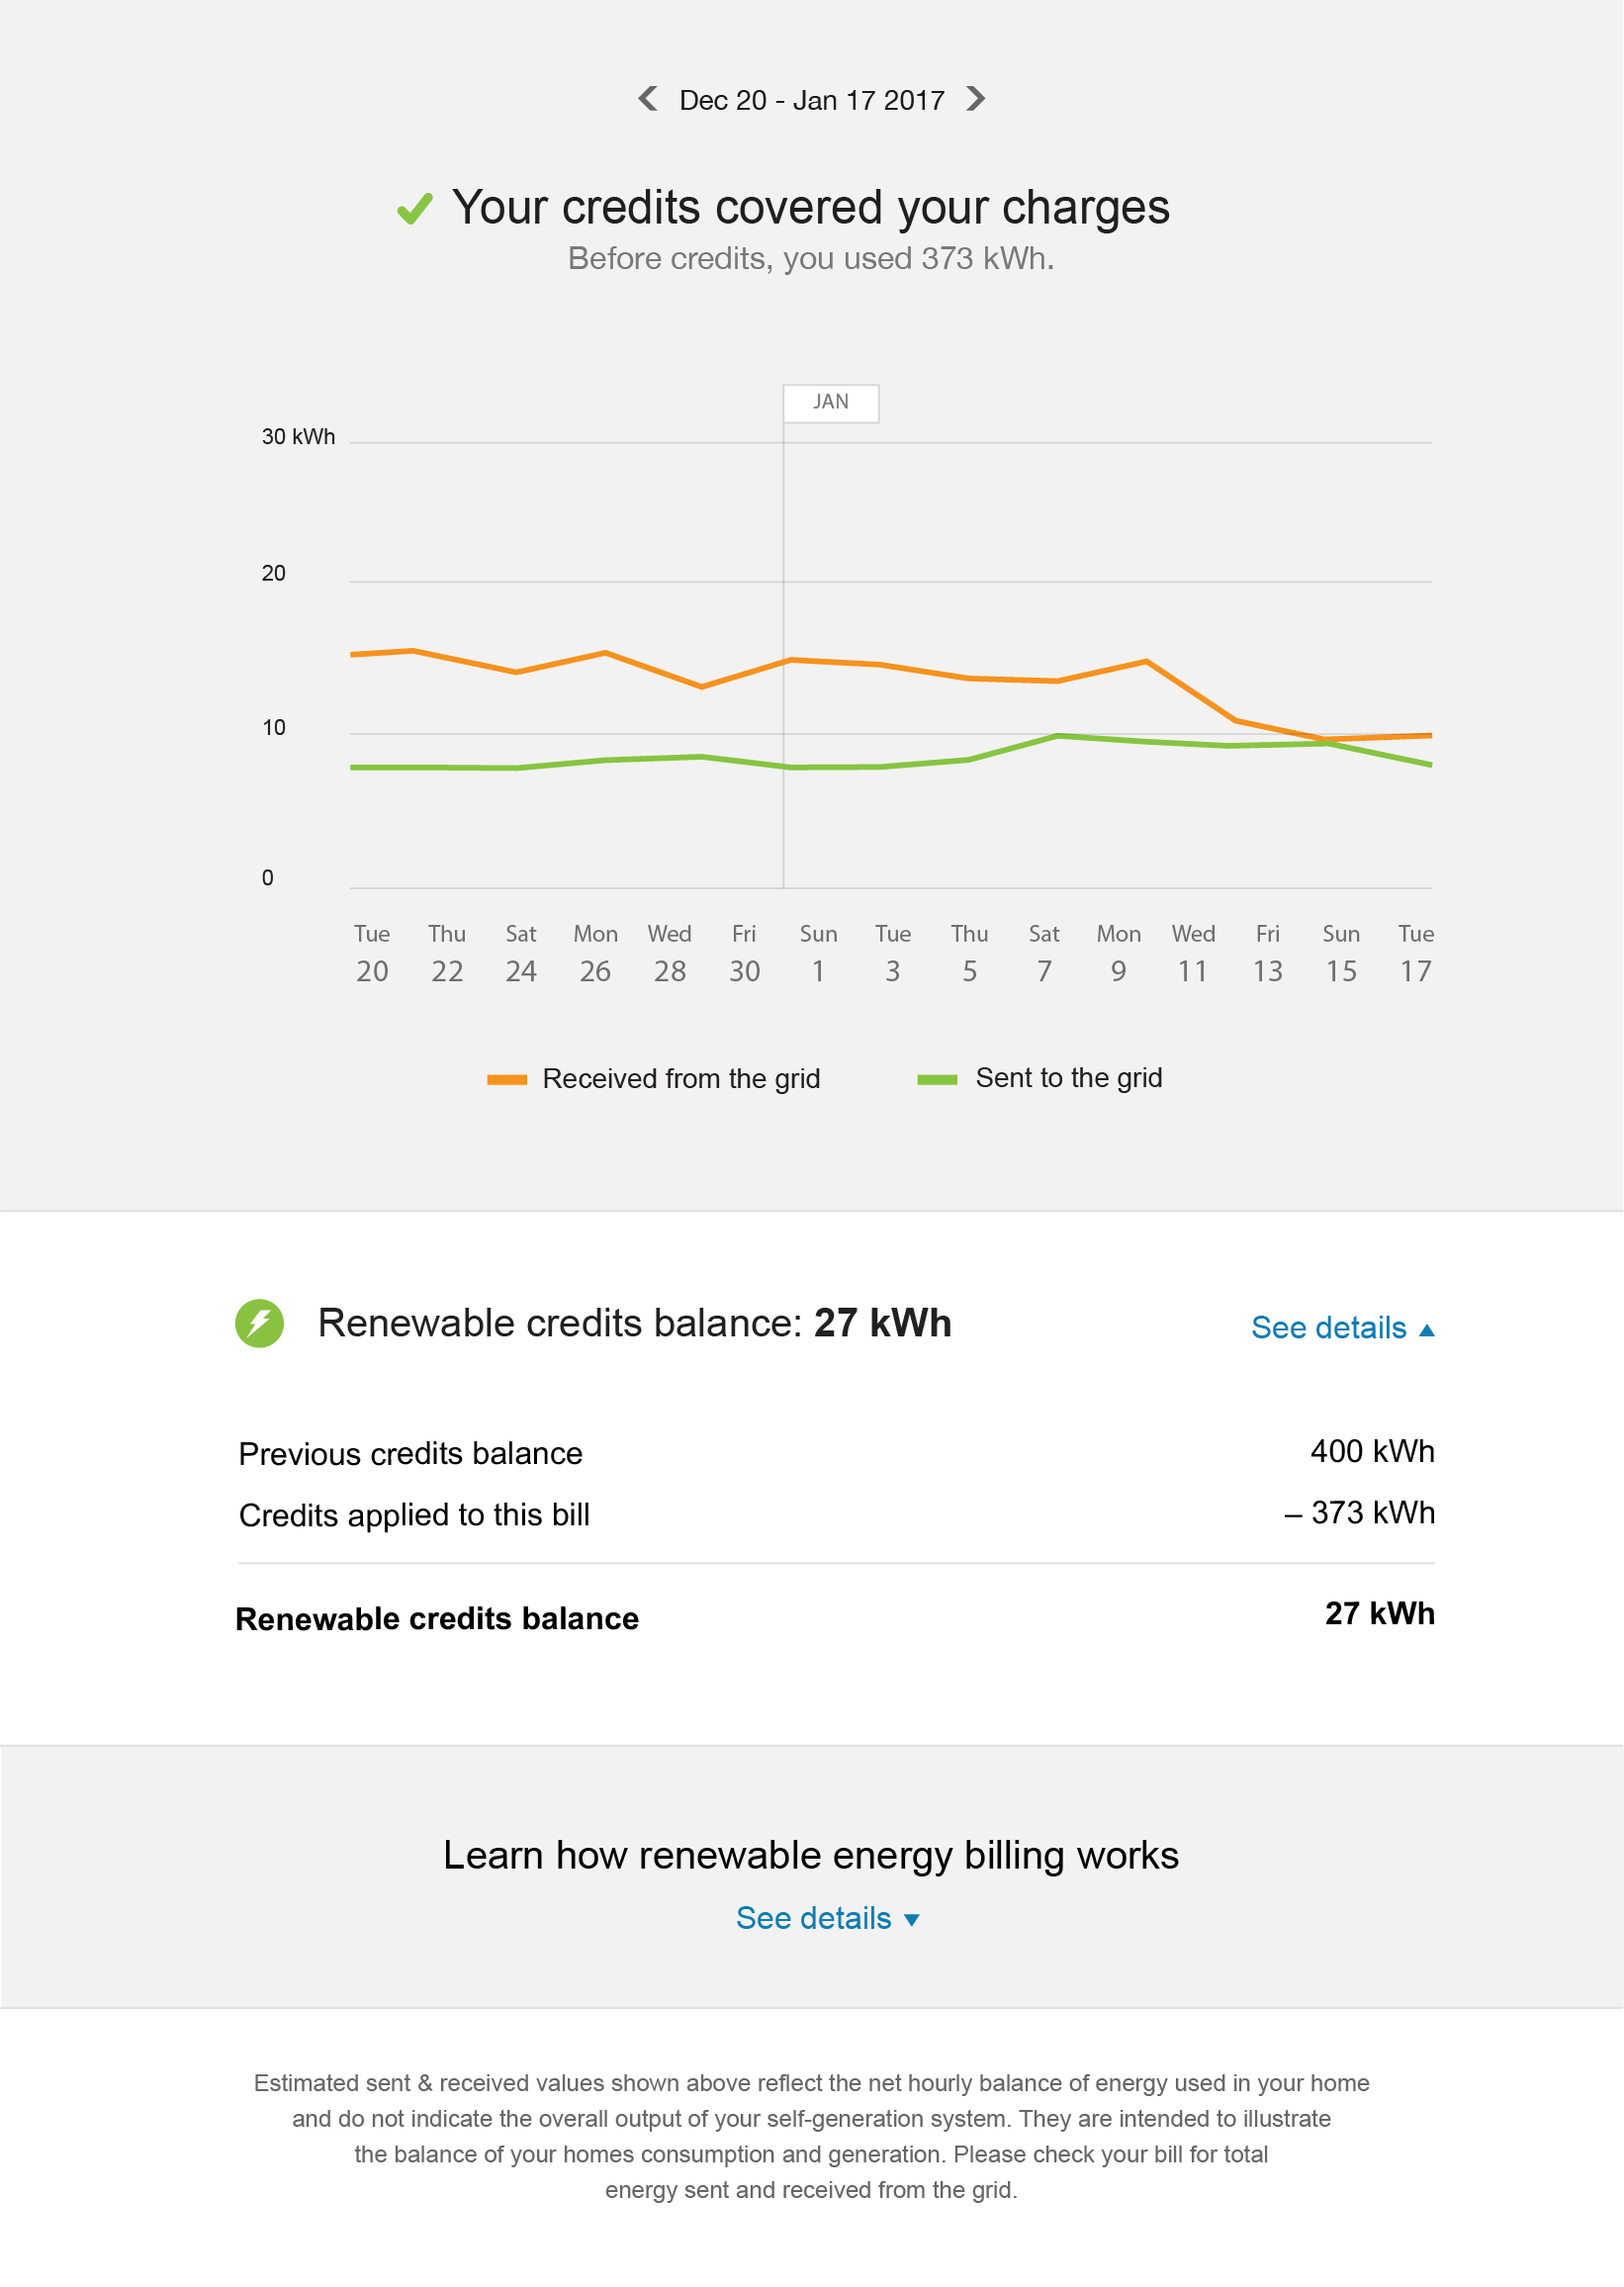
User can login and see a high-level insight on whether they broke even
- They can interact with the graph if they want to get more detailed information or look at past bills.
- If you're constantly generating more energy than your spending, you gain an energy balance that can be applied to future bills and occasionally cashed out.
- User can learn more about renewable energy billing in the expandable section below.
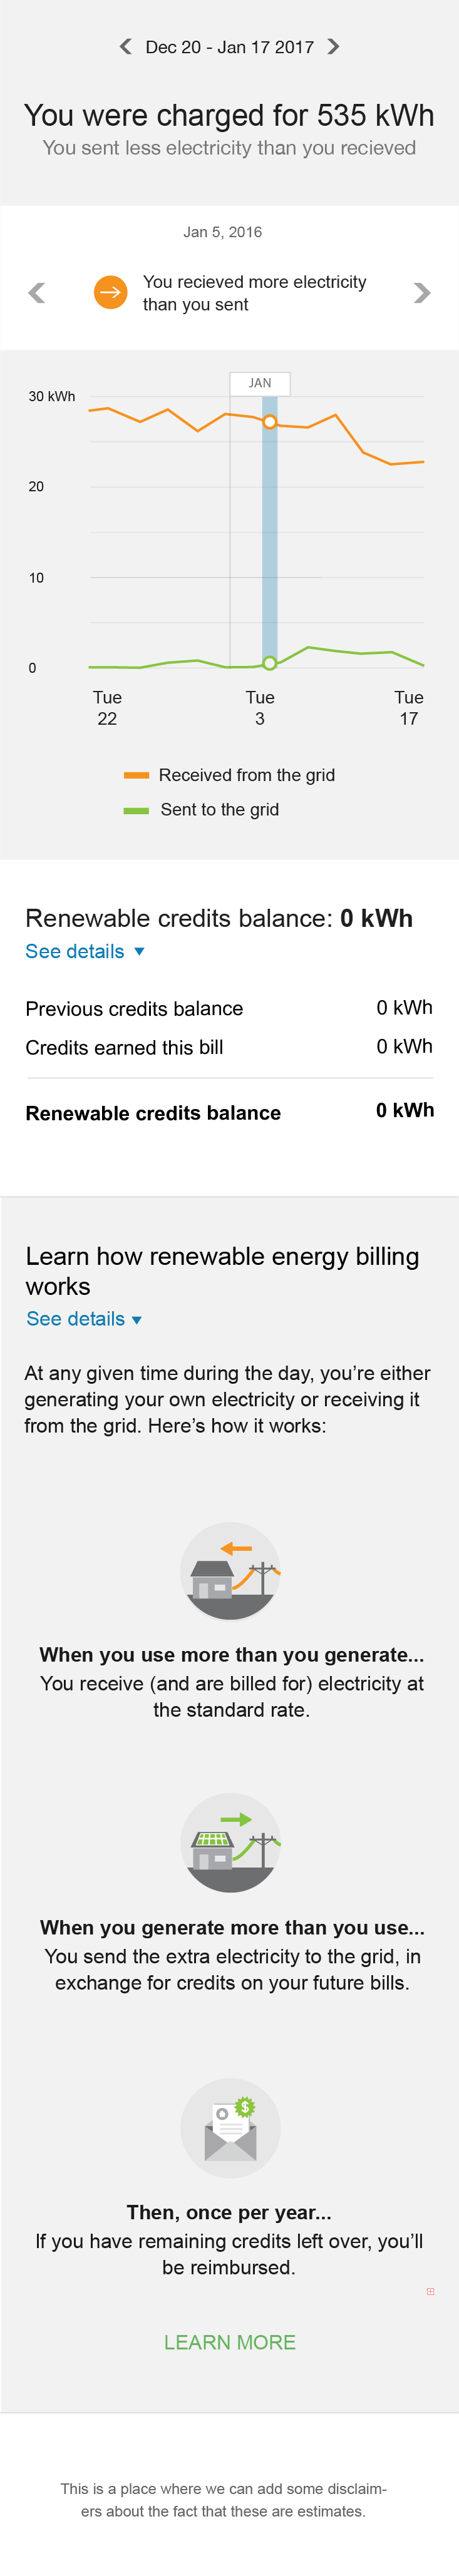
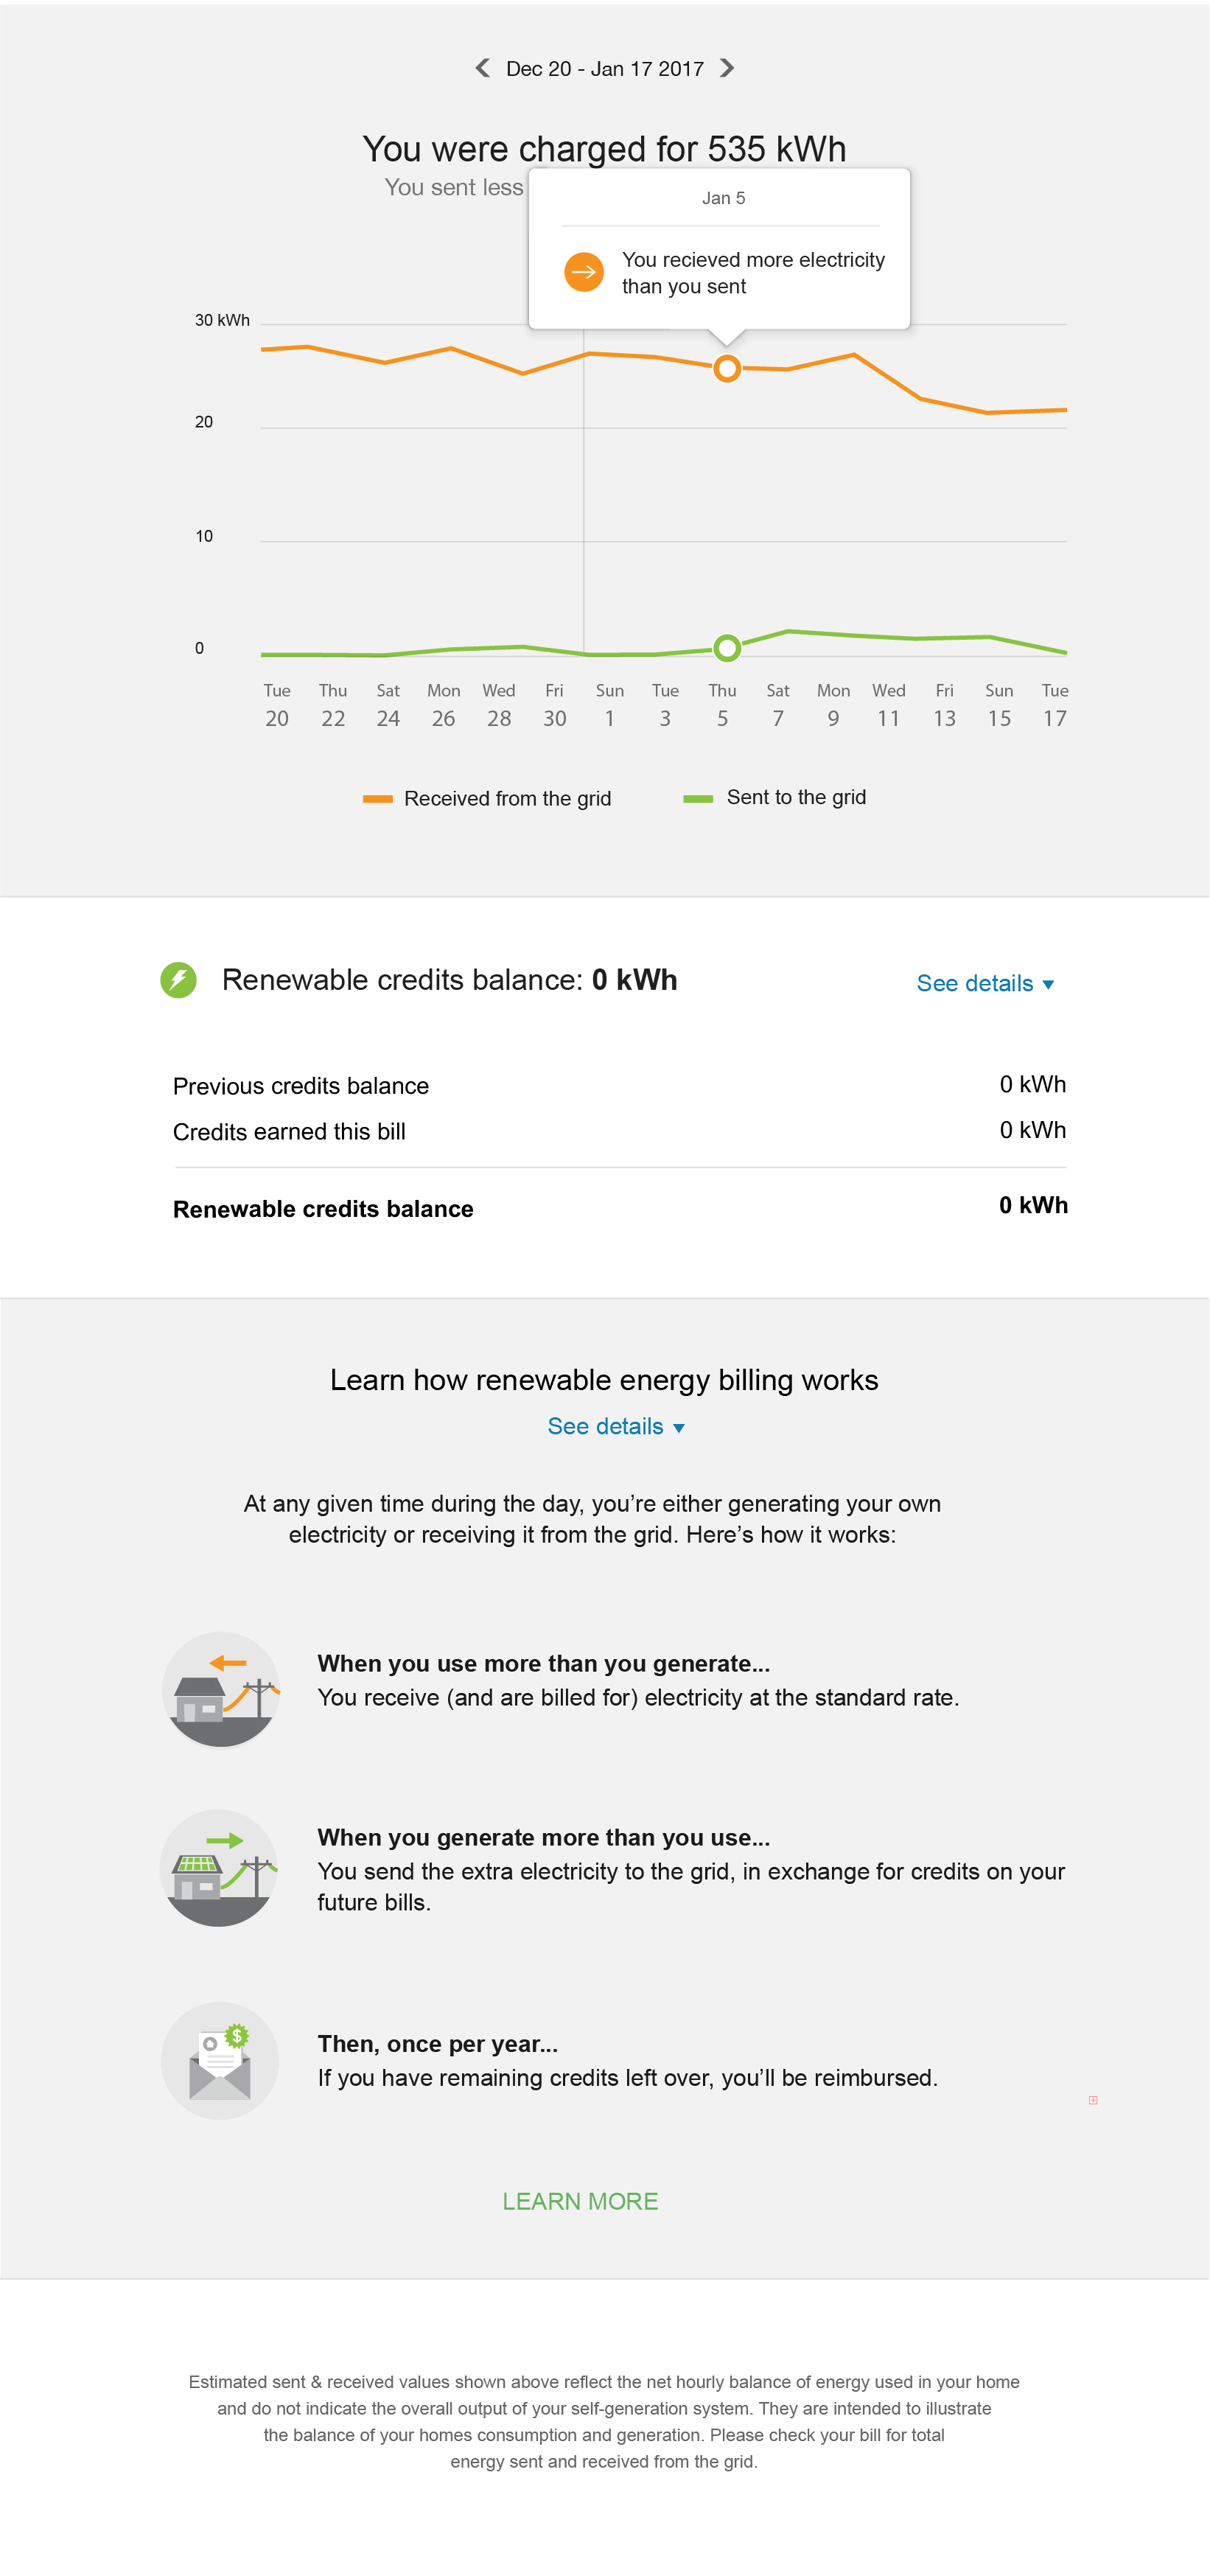
User can expand the educational section to learn more.
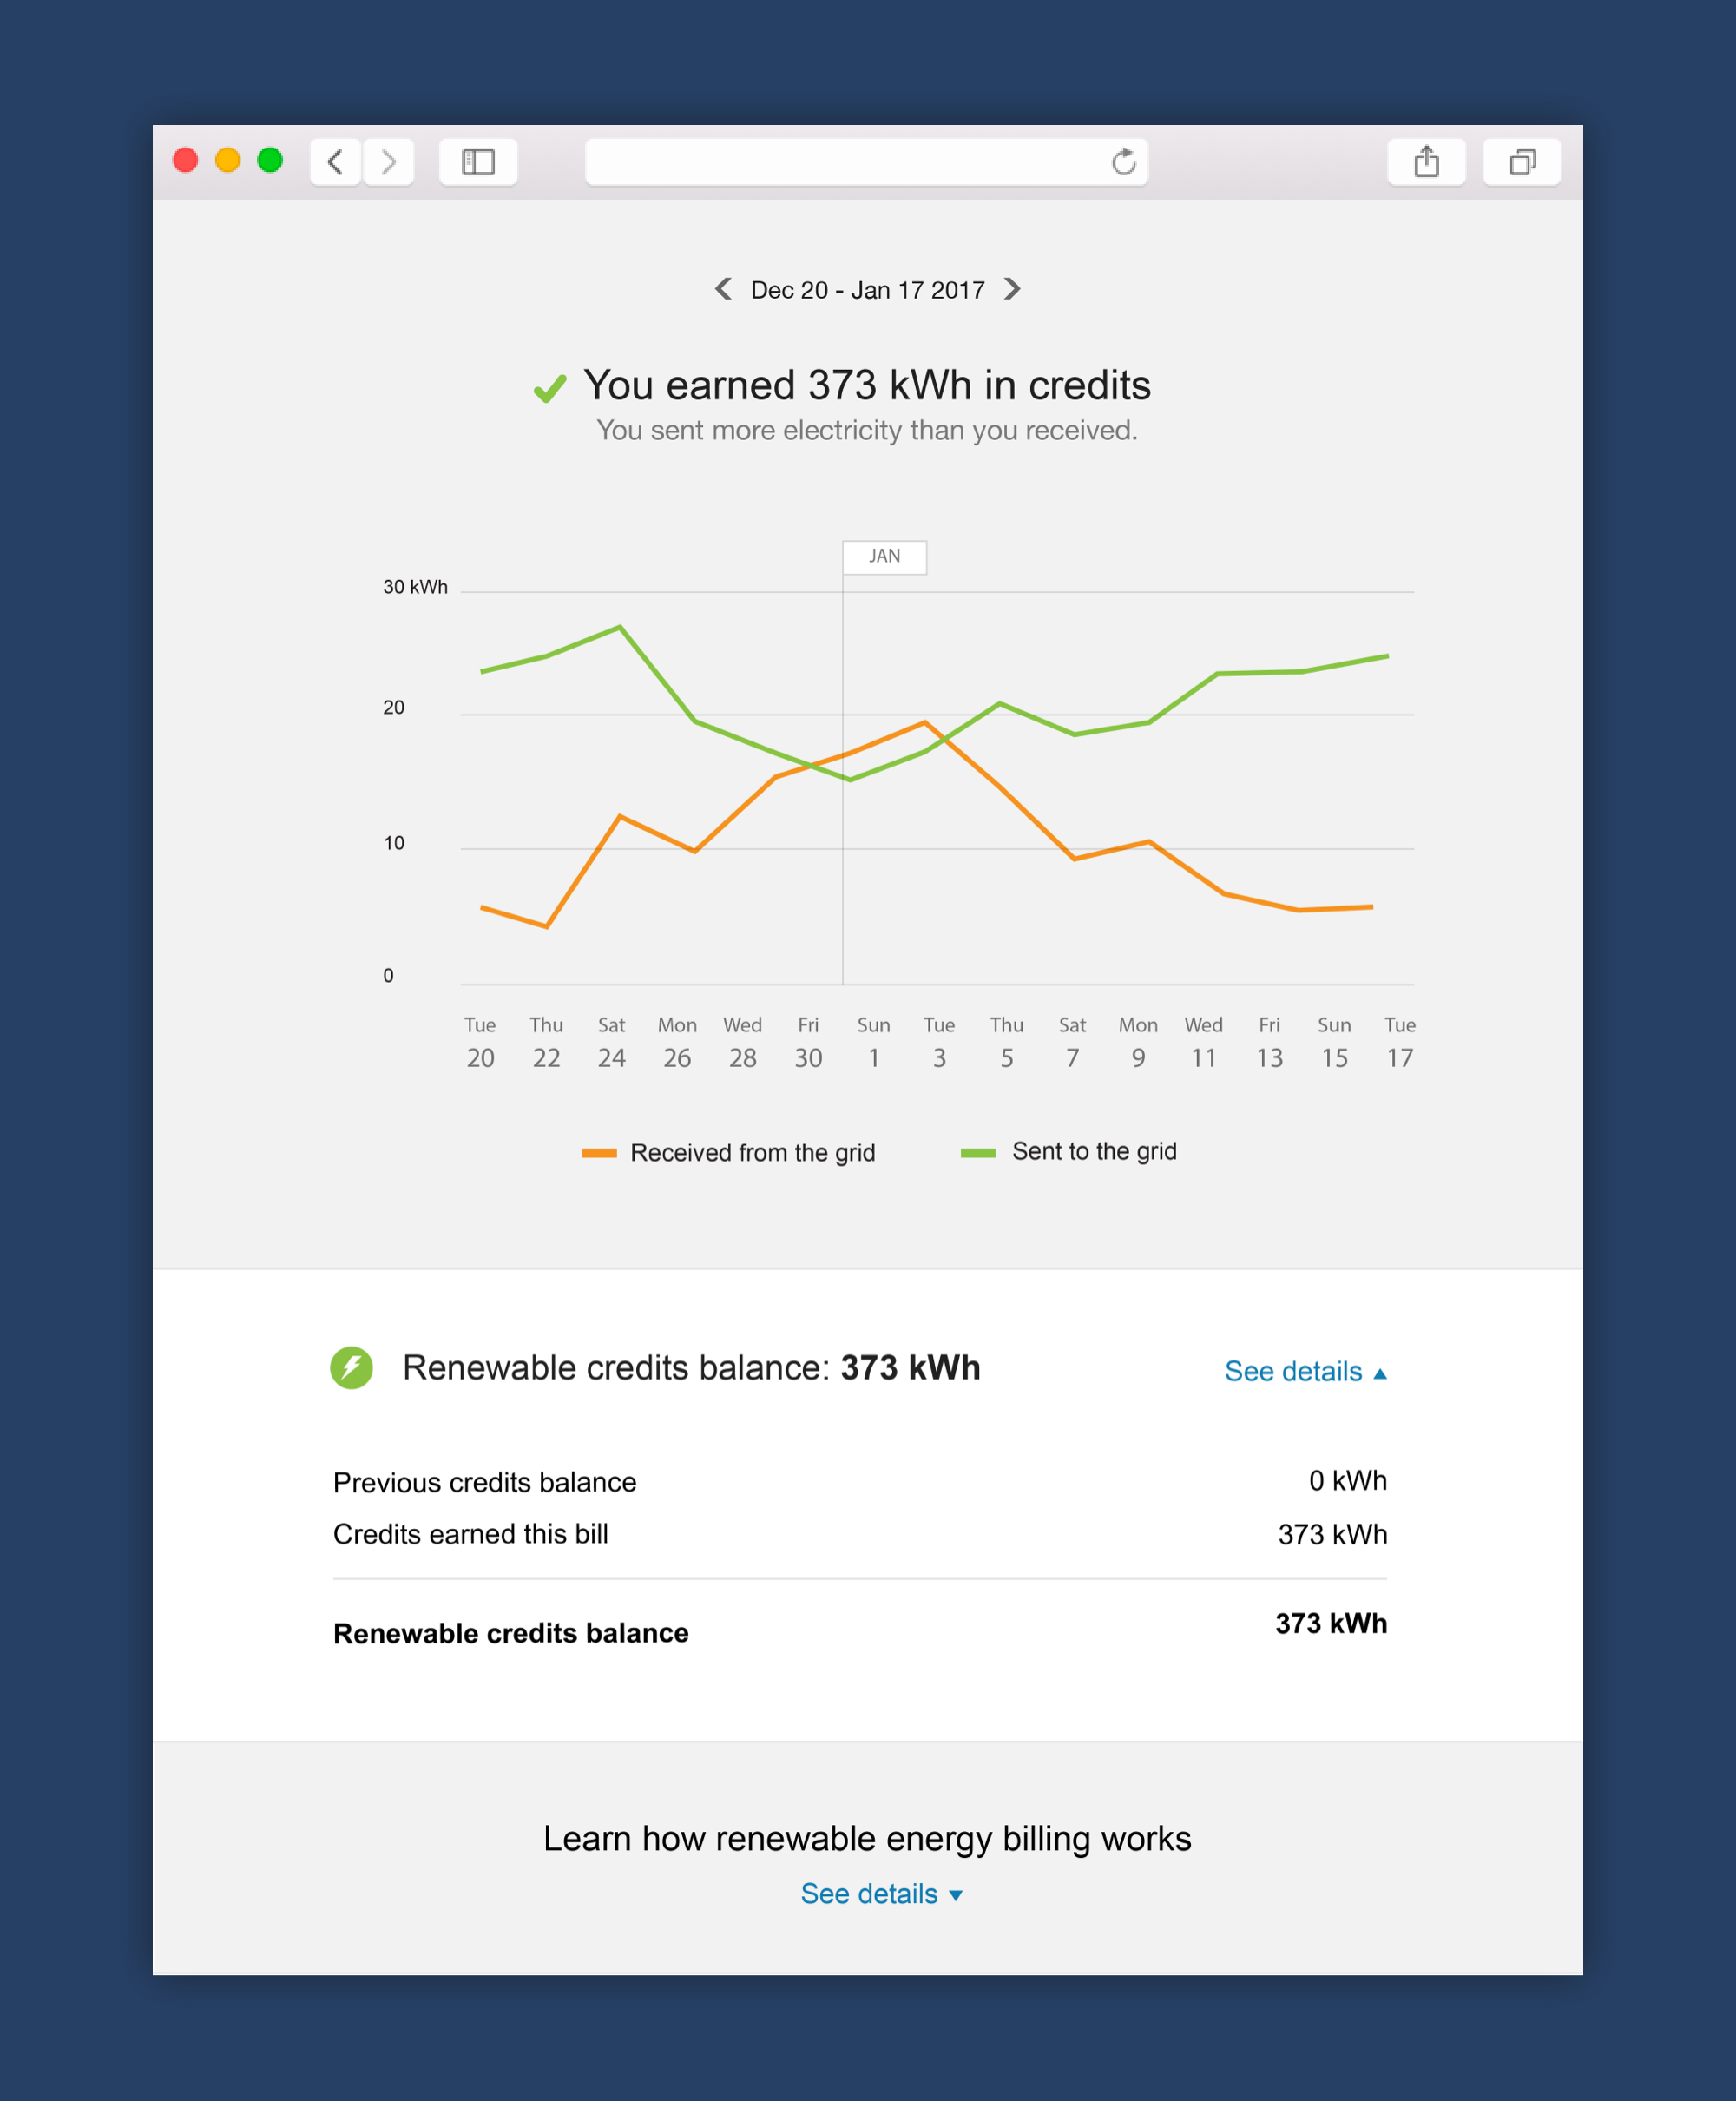
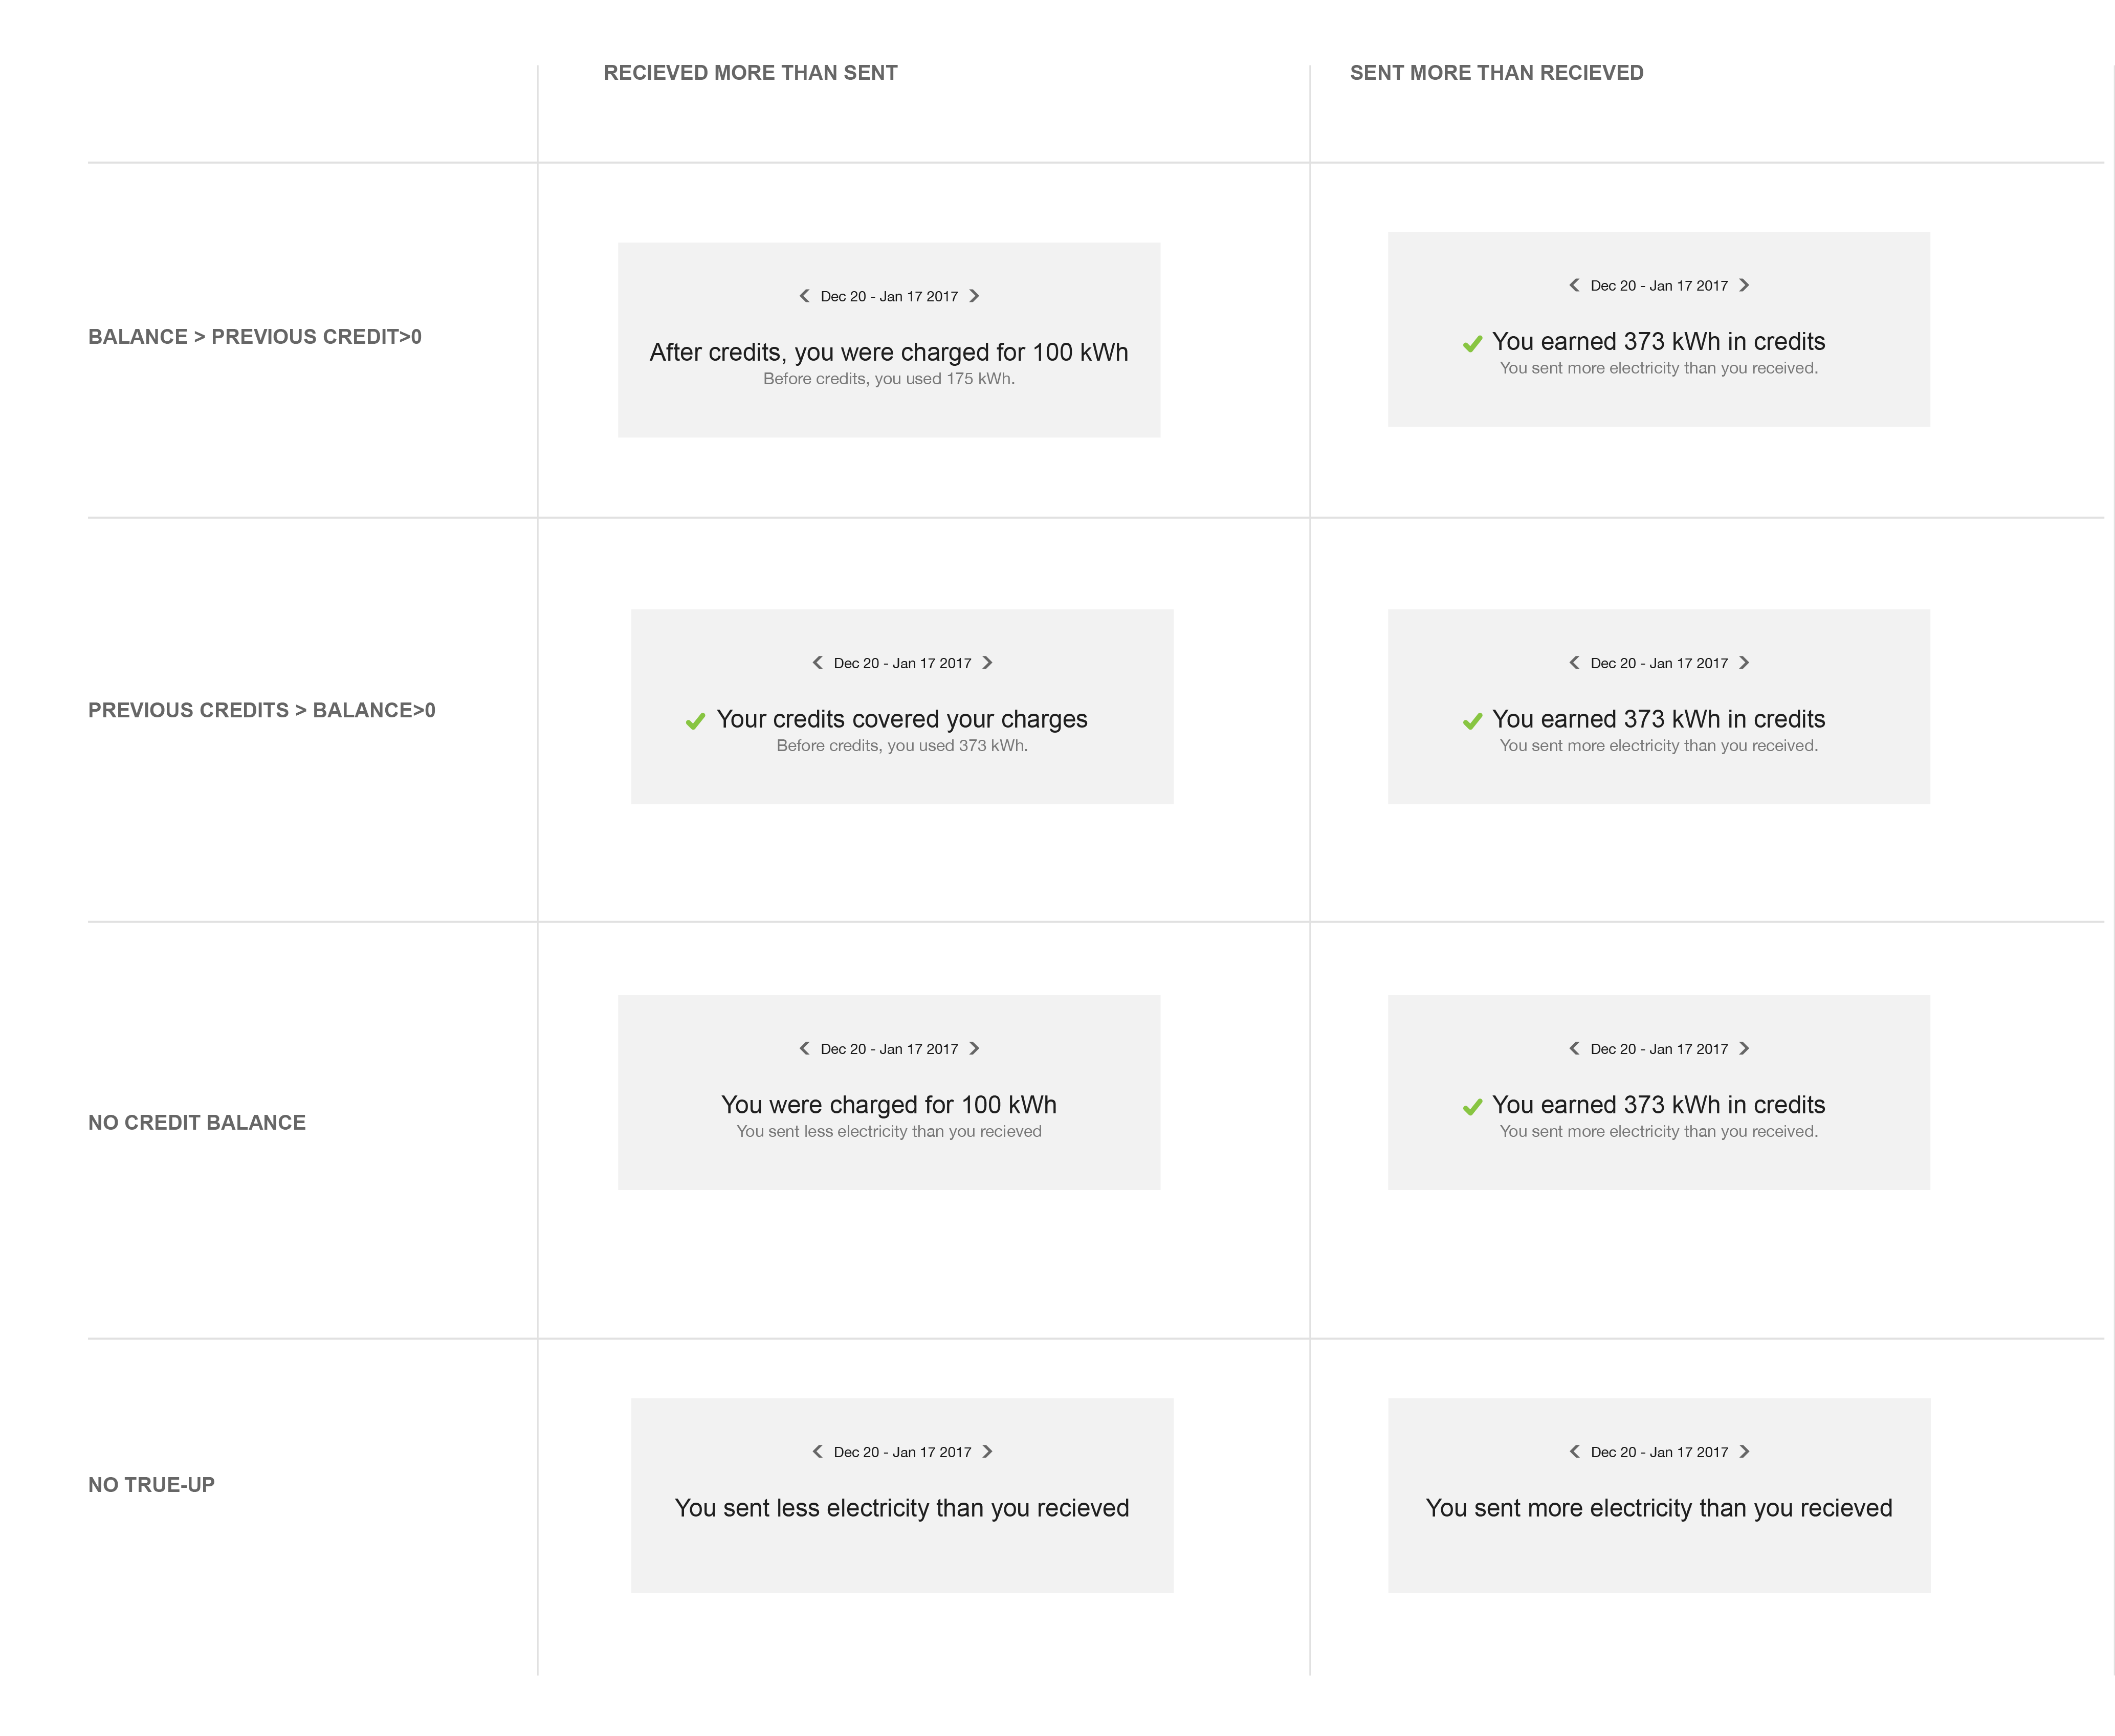
Insights adapt depending on customers standing
Mobile responsive views